
Key Takeaways
- California’s violent crime, property crime, and homicide rates all fell substantially in 2025, with early 2026 data showing the downward trend continuing in many major cities.
- Oakland still records among the highest violent- and property-crime rates for large U.S. cities, but its 2025–2026 data show sharp, broad-based declines in homicides and other serious offenses.
- Small cities such as Emeryville, Barstow, Marysville, Red Bluff, and Commerce can appear unusually high on per-capita crime lists because their small resident populations and large daytime/commercial activity inflate rates.
Quick Answer – Oakland remains one of the clearest examples of a high-crime California city, particularly when large cities are compared using violent and property crime rates. However, there is no official FBI list declaring one city the “most dangerous,” and Oakland itself experienced a substantial drop in reported crime during 2025.
California Crime Statistics: Latest Official Data
The newest complete statewide California crime statistics available for this 2026 update are for calendar year 2025.
| Crime Measure | 2024 | 2025 | Change |
|---|---|---|---|
| Violent crime rate | 480.3 per 100,000 | 431.1 per 100,000 | -10.2% |
| Property crime rate | 2,082.7 per 100,000 | 1,785.8 per 100,000 | -14.3% |
| Homicide rate | 4.3 per 100,000 | 3.5 per 100,000 | -18.6% |
| Reported homicides | 1,666 | 1,374 | -17.5% |
| Total arrest rate | 2,673.8 per 100,000 | 2,770.4 per 100,000 | +3.6% |
According to the California Department of Justice , California’s violent crime rate fell 10.2% in 2025, from 480.3 to 431.1 reported violent crimes per 100,000 residents. The property crime rate fell 14.3%, from 2,082.7 to 1,785.8 per 100,000. California also recorded 1,374 homicides in 2025, down 17.5% from 1,666 in 2024.
These statewide figures provide important context for city-level rankings. California became safer on several major statewide crime measures in 2025, but crime rates continued to vary substantially between individual cities. Therefore, a city appearing near the top of a “most dangerous” ranking does not necessarily mean crime increased there in 2025.
With that said, authorities in California are actively trying to reduce the crime rate. Compared with the national level, the FBI’s 2025 Reported Crimes in the Nation data, released on August 14, 2026, showed an estimated 9.3% decline in violent crime from 2024 to 2025. Murder and nonnegligent manslaughter declined by an estimated 18.1%, robbery by 18.5%, rape by 7.6%, and aggravated assault by 7.2%.
Top 10 Most Dangerous Cities in California (2026 Updates)
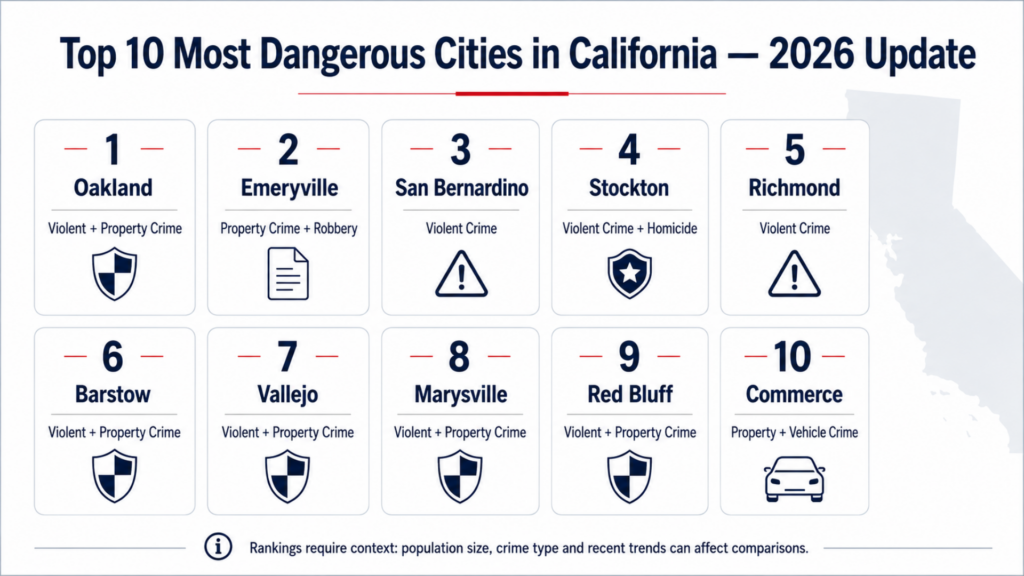
Top 10 Most Dangerous Cities in California (2026 Updates)
| Rank | City | Primary Crime Concern | Important Context |
|---|---|---|---|
| 1 | Oakland | Violent crime and property crime | Oakland has historically recorded high violent- and property-crime rates among California’s larger cities, although reported crime declined substantially in 2025. |
| 2 | Emeryville | Property crime and robbery | Emeryville’s small residential population can produce unusually high per-capita crime rates, particularly for property offenses, making comparisons with larger cities less straightforward. |
| 3 | San Bernardino | Violent crime | San Bernardino continues to experience elevated violent-crime levels compared with California overall, although crime rates can vary significantly from year to year. |
| 4 | Stockton | Violent crime and homicide | Stockton has historically reported violent-crime rates above the California average, with homicide and aggravated assault among its significant public-safety concerns. |
| 5 | Richmond | Violent crime | Richmond has historically experienced elevated levels of violent crime, but its crime rate has improved considerably over the longer term. |
| 6 | Barstow | Violent and property crime | Barstow’s relatively small population means that a modest change in the number of reported offenses can cause a substantial change in its per-capita crime rate. |
| 7 | Vallejo | Violent crime and property crime | Vallejo continues to face concerns involving violent offenses and property crime, although annual crime levels have fluctuated over time. |
| 8 | Marysville | Violent and property crime | Marysville’s small population can make its per-capita crime rates more volatile, so annual rankings should be interpreted alongside the underlying number of reported offenses. |
| 9 | Red Bluff | Violent and property crime | Red Bluff has reported relatively high crime rates for a city of its size, but its small population can make year-to-year per-capita comparisons particularly sensitive to changes in reported offenses. |
| 10 | Commerce | Property and vehicle crime | Commerce has a large commercial and industrial presence relative to its residential population. This can make resident-based crime rates less representative of the city’s daytime population and activity. |
1. Oakland
Oakland is one of California’s highest-crime large cities by recent FBI-reported crime rates, but reported crime declined substantially in 2025. The city continues to have elevated violent- and property-crime rates compared with many other large U.S. cities, while recent Oakland Police Department data show a significant improvement in several major crime categories.
Is Oakland Dangerous?
Oakland has a high crime rate, particularly for violent crime and property crime, but describing the entire city as uniformly dangerous would be misleading. Crime varies considerably by neighborhood, type of offense, and time of day. Recent data also show that Oakland’s overall crime trend improved significantly during 2025.
According to analysis of 2024 FBI city-level crime data, Oakland recorded 1,925 violent crimes per 100,000 residents. That was the second-highest violent-crime rate among 217 U.S. cities with populations of at least 100,000 for which comparable data were available. Oakland also recorded 7,230 property crimes per 100,000 residents, the highest property-crime rate in that comparison.
These figures place Oakland among the large U.S. cities with the highest reported crime rates. However, they represent 2024 data and should be considered alongside the city’s more recent 2025 crime statistics.
Oakland Crime Rate Declined in 2025
The Oakland Police Department (OPD) reported a substantial decline in crime during the first half of 2025. Comparing January 1 to June 30, 2025, with the same period in 2024, OPD reported:
- Violent crime: down 29%
- Homicide: down 21%
- Aggravated assault: down 18%
- Rape: down 24%
- Robbery: down 41%
- Burglary: down 19%
- Motor vehicle theft: down 45%
- Larceny: down 17%
The decline was broad-based across major crime categories, although arson increased by 9% during the same period.
OPD’s later 2025 reporting showed that the improvement continued. Through the September 15-21 reporting period, year-to-date violent crime was down 26% compared with the corresponding period in 2024, while homicides were also down 26%.
Is Oakland Safe?
Oakland’s recent crime data present a mixed picture. The city’s 2024 FBI-reported rates were among the highest recorded for large U.S. cities, particularly for property crime. At the same time, OPD data show that violent crime and several major property offenses declined substantially during 2025.
Therefore, the most accurate way to describe Oakland in 2026 is not simply as a city where crime is increasing. Oakland has a high reported crime rate, but its crime trend improved significantly during 2025. Safety also varies by neighborhood, so citywide crime statistics do not necessarily reflect conditions in every part of Oakland.
2. Emeryville
Emeryville has a high reported crime rate, particularly for property crime, but its crime statistics need to be interpreted in the context of the city’s small residential population and large commercial and employment base.
Emeryville is a small city in Alameda County with approximately 10,000 to 13,000 residents and about 20,000 to 22,000 jobs, according to the City of Emeryville. That means the number of people present in the city during the day can be substantially higher than its resident population because of employees, shoppers, visitors, and commuters.
This population difference is important when interpreting Emeryville’s crime rate. Per-capita crime rates are generally calculated using the number of reported offenses divided by the resident population. As a result, crimes occurring in busy commercial areas can have a greater effect on Emeryville’s per-resident crime rate than they would in a much larger residential city.
Is Emeryville Dangerous?
Property crime is a significant concern in Emeryville, although recent police data show that both property and violent crime declined in 2025.
According to the Emeryville Police Department’s official July 2025 crime statistics, the city recorded 778 Part I property crimes from January through July 2025, a 24% decrease compared with the same period in 2024. The largest categories included:
- Petty theft: 381 incidents
- Auto burglary: 129 incidents
- Auto theft: 113 incidents
- Grand theft: 101 incidents
Violent crime also declined. Emeryville recorded 134 Part I violent crimes through July 2025, compared with 173 during the same period in 2024, a 23% decrease. Robbery declined 49%, while aggravated assault declined 35%.
The city’s official crime statistics page provides monthly reports, including data through April 2026, making it the best primary source for checking Emeryville’s most recent reported crime trends.
Why Is Emeryville’s Crime Rate So High?
Emeryville’s unusually high crime rate is partly influenced by the city’s population structure. The city has a relatively small residential population but a much larger employment and commercial presence. The City of Emeryville has described the community as an employment center with approximately 20,000 to 22,000 jobs and about 10,000 to 13,000 residents.
This creates an important limitation when comparing Emeryville’s crime rate with cities such as Oakland, Los Angeles, or San Diego. A crime rate calculated per resident does not count the employees, shoppers, and visitors who enter the city during the day in its denominator.
This does not mean Emeryville’s crime problem is only a statistical effect. The city’s own police data confirm that theft, auto burglary, vehicle theft, and other property offenses occur at significant levels. The population and commercial context simply help explain why Emeryville can appear unusually high on per-capita crime rankings.
3. San Bernardino
San Bernardino remains one of California’s higher-crime cities, particularly for violent crime. Its crime profile is marked by elevated rates of violent offenses, including aggravated assault and robbery, although recent city-level data show that several major offenses have declined.
The city’s violent-crime burden is substantially higher than California’s statewide level. In October 2024, the California Governor’s Office reported that San Bernardino’s violent-crime rate was nearly twice the statewide average, while its homicide rate was more than three times the statewide rate. The state also identified vehicle theft as an ongoing public-safety concern in the city.
Why San Bernardino Ranks Among California’s Most Dangerous Cities?
Recent data continue to show a significant violent-crime burden. The San Bernardino Police Department‘s 2025 data through May recorded 834 violent crimes, including 191 robberies, 584 aggravated assaults and eight homicides. Robbery was down 25%, and firearm-related assaults declined 19% from the comparable period in 2024, although aggravated assault increased 8%.
These figures place violent crime, not property crime alone, at the center of San Bernardino’s ranking.
However, the city has also seen improvement in several serious offenses, so its current crime picture is better described as high but mixed, rather than uniformly worsening. For comparison, California’s statewide violent-crime rate fell 10.2% in 2025 to 431.1 per 100,000 residents.
4. Stockton
Stockton’s position on this list is largely driven by its persistent violent-crime burden, particularly serious assaults, robbery and homicide. Unlike cities that rank highly because of property crime alone, Stockton’s public-safety profile has historically been shaped by violent offenses.
Why Stockton Ranks Among California’s Most Dangerous Cities?
The Stockton Police Department’s July 2026 crime comparison recorded 310 violent-crime incidents year to date, compared with 316 during the same period in 2025, a 2% decline. The department also recorded 3 homicides through July 2026, compared with 2 in the same period of 2025, while non-fatal shootings fell 70%, from 10 to 3.
Property crime showed a mixed pattern. In July 2026 alone, Stockton recorded 100 burglaries, 421 larceny/theft incidents and 89 motor-vehicle thefts. Total reported incidents for the month were 936, unchanged from July 2025.
These figures help explain why the city continues to experience a substantial number of violent offenses, even though its 2026 year-to-date violent crime has declined slightly and non-fatal shootings have fallen sharply. The latest data therefore show a high but improving crime profile rather than a uniform increase in crime.
5. Richmond
Richmond’s position on this list reflects its historically high violent-crime burden, particularly gun violence and homicide. However, the city’s recent data show a more complicated picture, with meaningful declines in shootings and some violent-crime categories alongside continued concerns in others.
Richmond’s Recent Crime Trends
Richmond recorded 54 homicides in 2025, the same number reported in 2024, while the number of shootings fell to its lowest level since 2015. However, overall violent crime increased by approximately 8% compared with 2024, indicating that improvements in gun violence did not extend evenly across all categories.
The city has also continued to invest in targeted violence-prevention strategies, including focused-deterrence programs aimed at people at elevated risk of involvement in gun violence, as well as community-based intervention efforts.
Early 2026 figures showed further improvement in several categories. During the first quarter of 2026, Richmond recorded 7 homicides, compared with 15 during the same period in 2025, while nonfatal shootings declined from 39 to 33. Robbery and rape also decreased during the same period.
These figures show why Richmond remains relevant in a California crime ranking while also demonstrating signs of progress. The city continues to experience a substantial violent-crime burden, but recent reductions in shootings and several serious offenses suggest that its current position should be considered alongside its changing crime trends, rather than based solely on its historical reputation.
6. Barstow
Barstow’s inclusion on this list is largely driven by its high reported crime rates relative to its relatively small population, particularly for violent offenses, burglary and motor-vehicle theft.
Barstow’s Crime Profile and Population Effect
The latest available FBI-based figures for 2024 show Barstow with an estimated violent-crime rate of about 1,108 per 100,000 residents, more than twice California’s rate of approximately 486 per 100,000. The city also recorded elevated rates for robbery, assault, burglary and motor-vehicle theft compared with the statewide figures.
Population size is important when interpreting these figures. In a smaller city such as Barstow, a relatively small number of additional reported incidents can produce a substantial change in the crime rate per 100,000 residents. This can make per-capita rankings more volatile than comparisons involving California’s largest cities.
7. Vallejo
Vallejo stands out in California crime rankings because of its long-running pattern of gun violence and homicide, although the city has recorded a notable reduction in killings from its recent peak.
What the Latest Crime Data Show in Vallejo
Vallejo recorded 17 homicides in 2025, down from 25 in 2024. Firearms were involved in 13 of the 17 killings in 2025, highlighting the continued role of gun violence in the city’s overall crime profile.
The improvement did not mean that violent crime disappeared. By early August 2026, Vallejo had recorded 9 homicides, with six occurring after May 1. The figures indicate that serious violence remains an ongoing public-safety issue even after the decline from 2024 levels.
8. Marysville
Marysville is a small city in Yuba County, which means per-capita crime statistics can be more sensitive to changes in the number of reported offenses than statistics from California’s largest cities. Marysville’s relatively high position in crime-rate comparisons is largely explained by its elevated violent-crime and motor-vehicle theft rates, particularly when those offenses are measured against the city’s relatively small population.
Is Marysville Dangerous?
Marysville’s latest complete FBI-based data show that violent crime remains the more significant concern compared with the statewide rate. In 2024, the city recorded 94 violent crimes, producing a violent-crime rate of approximately 745 per 100,000 residents. California’s statewide rate was about 486 per 100,000 that year.
The city’s violent-crime total included:
- 2 homicides
- 6 rapes
- 10 robberies
- 76 aggravated assaults
Property crime was more common in absolute numbers. Marysville recorded 260 property crimes in 2024, including 153 thefts, 26 burglaries and 81 motor-vehicle thefts. Its motor-vehicle theft rate was approximately 642 per 100,000 residents, substantially above California’s statewide rate of about 428 per 100,000.
Why Does Marysville Have a High Crime Rate?
Marysville’s high crime ranking is influenced by its elevated rates of violent crime and motor-vehicle theft relative to California. In 2024, its violent-crime rate was about 745 per 100,000 residents, compared with approximately 486 statewide, while its motor-vehicle theft rate was about 642 per 100,000, versus 428 statewide.
Because Marysville has a relatively small population, changes in the number of reported offenses can also produce larger swings in its per-capita crime rate than in larger California cities. The ranking therefore reflects reported crime relative to population, not uniform risk across every neighborhood.
9. Red Bluff
Red Bluff stands out in California crime comparisons because its violent- and property-crime rates are high relative to its population, particularly for aggravated assault, larceny-theft and motor-vehicle theft.
Red Bluff’s Crime Profile
According to 2024 FBI data, Red Bluff reported 183 violent crimes and 609 property crimes. Violent offenses included 120 aggravated assaults, 33 robberies, 29 rapes and 1 homicide. Among property offenses, larceny-theft accounted for 515 incidents, followed by 67 motor-vehicle thefts and 27 burglaries.
The city’s violent-crime rate was approximately 1,277 per 100,000 residents, placing Red Bluff among California cities with the highest reported violent-crime rates in 2024 among cities with populations of at least 10,000.
Red Bluff’s relatively small population also matters when interpreting these figures. A change in the number of reported offenses can have a more noticeable effect on a per-capita rate in a smaller city than in a major metropolitan area. For that reason, multi-year crime trends provide better context than treating a single year’s rate as a permanent measure of safety. The California DOJ also cautions that crime comparisons should account for reporting differences and data limitations between agencies.
10. Commerce
Commerce stands out in California crime comparisons because its reported crime rates are exceptionally high relative to its small residential population, particularly for property crime. The city recorded 1,417 property crimes and 166 violent crimes in 2024, according to FBI-based data.
Commerce has a 2024 population estimate of approximately 11,882 residents, according to the U.S. Census Bureau. At the same time, the city is a major commercial and industrial area in southeast Los Angeles County, with extensive freeway, rail, retail and industrial activity.
Why Is Commerce’s Crime Rate So High?
The 2024 FBI-based figures show that Commerce’s crime profile is not limited to property offenses. The city recorded 70 robberies, 88 aggravated assaults, 186 burglaries, 850 thefts and 381 motor-vehicle thefts. Its reported violent-crime rate was approximately 1,448 per 100,000 residents, while its property-crime rate was about 12,360 per 100,000.
Commerce’s small residential population is important when interpreting these per-capita figures. Crime rates calculated per 100,000 residents use the resident population as the denominator, even though a commercial and industrial city can have substantial numbers of workers, shoppers, commuters, and other visitors present during the day.
That does not mean Commerce’s crime statistics are merely a population effect. The reported number of violent and property offenses is substantial. However, the city’s unusual population and land-use characteristics mean that its per-resident crime rate should be interpreted with more context than a simple “most dangerous” label suggests.
What About Compton, Bakersfield, Fresno, San Francisco and Los Angeles?
The absence of Compton, Bakersfield, Fresno, San Francisco or Los Angeles from a particular top-10 list does not mean these cities have low crime rates. It means that, under the methodology and year used for that ranking, other California cities had higher qualifying rates or a higher combined level of violent and property crime. This is why California crime rankings should always identify the data year, crime categories, and calculation method. A city can rank high for violent crime but lower for overall crime, or have a high number of reported offenses but a lower per-capita rate because of its larger population.
| City | Crime Profile | Why Rankings Can Differ |
|---|---|---|
| Compton | Compton has historically reported high rates of violent crime, including robbery and aggravated assault. | Its position can change depending on whether a ranking focuses on violent crime, homicide or overall crime. |
| Bakersfield | Bakersfield reports both violent and property crime at rates that can exceed California averages. | Its large population means individual incidents have less effect on its per-capita rate than they do in smaller cities. |
| Fresno | Fresno has reported high levels of both violent and property crime in recent FBI-based datasets. | Its position varies depending on the year and whether the ranking emphasizes violent crime or total crime. |
| San Francisco | San Francisco has historically had high property crime, particularly theft, although recent police data show substantial declines. | Rankings based on older data may place San Francisco differently from rankings using the latest available figures. |
| Los Angeles | Los Angeles has a large number of reported crimes because it is one of California’s largest cities, but its per-capita rate is different from its total number of offenses. | Citywide figures also combine neighborhoods with very different crime levels. |
Are Crime Rates in California Going Up or Down in 2026?
California’s crime trend is moving downward overall, with the latest 2025 statewide figures showing major declines and early 2026 data pointing in the same direction for several major offenses.
California’s 2025 violent-crime rate fell 10.2%, from 480.3 to 431.1 crimes per 100,000 residents. Property crime fell 14.3%, while the homicide rate declined 18.6% to 3.5 homicides per 100,000 residents.
The national trend was similar. The FBI’s preliminary 2025 figures reported the following changes from 2024:
| U.S. Crime Category | Change |
|---|---|
| Violent crime | -9.3% |
| Murder and non-negligent manslaughter | -18.1% |
| Robbery | -18.5% |
| Rape | -7.6% |
| Aggravated assault | -7.2% |
| Property crime | -12.4% |
Source: 2025 Crime Data
Safest Cities in California
California’s Southern Coast and Border region (Orange, San Diego, Imperial, Ventura Counties) recorded the state’s lowest violent crime rate in 2024 at 331 per 100,000 residents, per PPIC 2025. Several cities in this region consistently rank among the safest in the country by FBI UCR data.
| Irvine | Mission Viejo | Thousand Oaks | San Ramon |
|---|---|---|---|
Consistently among the safest large U.S. cities. Violent crime rate far below CA state average. Part of Orange County — lowest violent crime region. NeighborhoodScout (FBI UCR) | Mission Viejo is an Orange County city with historically low crime across all categories per FBI UCR data published by CA DOJ. CA DOJ OpenJustice | Part of Ventura County — in the Southern Coast region with California’s lowest regional violent crime rate (331 per 100,000 in 2024, per PPIC). PPIC 2025 | East Bay suburb with consistently low violent crime despite being located near higher-crime Alameda County cities. CA DOJ OpenJustice |
How to Stay Safe in California’s High-Crime Cities
| Use Official Crime Maps | CA DOJ’s OpenJustice and the FBI’s Crime Data Explorer let you look up any city. NeighborhoodScout shows neighborhood-level breakdowns based on the same FBI data. | Protect Your Vehicle | Auto theft is still 19.3% above 2019 levels statewide (CA DOJ 2024). Never leave valuables visible in your car. Park in well-lit, high-traffic areas — especially in Oakland and other high-theft cities. |
|---|---|---|---|
| Understand Neighborhood Variation | City-wide averages hide massive internal variation. East Oakland has different risk levels than Rockridge. Use neighborhood-level data before making residential or travel decisions. | Report Crimes | All crime statistics — including these — are based on reported incidents. Unreported crimes affect resource allocation and data accuracy. Reporting matters even for property crimes that seem minor. |
| Support Proven Programs | Advance Peace has peer-reviewed evidence of gun violence reduction in Richmond, Stockton, and Fresno. advancepeace.org accepts community support. Evidence shows these approaches work. | Stay Aware — Day and Night | General crime prevention guidance consistently points to situational awareness as a key deterrent for opportunistic crime. Avoid isolated areas after dark. Trust your instincts about unfamiliar environments. |
Summing Up
The latest data tell a more nuanced story than a simple list of the most dangerous cities in California.
Oakland, San Bernardino, Stockton and several smaller California cities continue to report crime levels that merit attention. At the same time, California’s statewide violent crime, property crime and homicide rates all fell substantially in 2025, and cities such as Oakland have experienced some of their strongest recent improvements.
The most useful way to evaluate crime is therefore to combine current FBI and California DOJ data, per-capita rates, multi-year trends, reporting limitations and local context instead of relying on a city’s reputation or an outdated ranking.
Crime statistics also should not be confused with the outcome of an individual criminal case. A conviction or appeal is determined by the facts, record, applicable law and legal issues in the particular case, not by a city’s overall crime rate.
If you are challenging a criminal or civil judgment in California, Brownstone Law’s California appellate lawyers handle state and federal appellate matters and can review the record and appellate issues involved in your case.
Frequently Asked Questions (FAQs)
Q1. Is Oakland safe?
Oakland consistently ranks as the most dangerous city in California by combined crime rate. NeighborhoodScout’s 2024 FBI UCR analysis gives Oakland a combined crime rate of 91 per 1,000 residents, higher than more than 100% of California communities. That said, Oakland’s crime is declining: homicides were down 21% in 2025 year-to-date per The Oaklandside (Dec 2025).
Q2. Is California’s crime rate going up or down?
California’s crime rate is going down overall based on the latest complete statewide data. In 2025, California’s violent crime rate fell 10.2%, from 480.3 to 431.1 crimes per 100,000 residents. Property crime declined 14.3%, while the homicide rate dropped 18.6% to 3.5 per 100,000 residents.
However, crime trends vary by city. Some California cities continue to report crime rates well above the statewide average even as overall crime across the state declines.
Q3. What is the safest city in California?
The Southern Coast and Border region (Orange, San Diego, Imperial, Ventura Counties) had California’s lowest regional violent crime rate in 2024 at 331 per 100,000, per PPIC 2025. Within that region, cities like Irvine, Mission Viejo, and Thousand Oaks consistently appear near the top of FBI UCR-based safe city rankings.
Q4. Where can I find the official California crime data myself?
The primary sources are: CA DOJ annual reports at data-openjustice.doj.ca.gov; the CA DOJ OpenJustice interactive platform at openjustice.doj.ca.gov; and the FBI Crime Data Explorer at cde.ucr.cjis.gov. All three are free government tools updated annually.
Q5. Do community violence programs like Advance Peace actually work?
The evidence is genuinely strong, with important caveats. Richmond’s program was associated with 55% fewer annual firearm deaths (2010–2016) per a peer-reviewed American Journal of Public Health study (2019). Stockton saw a 21% gun homicide reduction over two years per a UC Berkeley study (2021). Fresno saw a 45% reduction during the program period per a 2023 UC Berkeley/CA BSCC evaluation. Researchers in all three studies note that attribution is complex and that continued rigorous evaluation is needed.
Q6. What Is the Murder Capital of California?
California does not have an official “murder capital.” The answer depends on whether the ranking measures the number of homicides or the homicide rate per 100,000 residents.
For a per-capita comparison, Blythe ranks among the California cities with the highest murder rates in recent FBI-based city-level data. However, this should not be confused with broader rankings of California’s most dangerous cities. Oakland, for example, ranks highly in broader crime comparisons because of its violent and property crime rates, but that does not make it California’s murder-rate leader.
California’s statewide homicide rate also declined substantially in 2025, falling 18.6% to 3.5 homicides per 100,000 residents, according to the California Department of Justice.
Q7. Why is San Bernardino so dangerous?
San Bernardino is considered a high-crime California city primarily because of its high rate of violent crime, particularly aggravated assault, robbery and homicide. Its crime rate has historically been well above the California statewide average, although crime levels have changed from year to year and recent data show improvement in some categories.
Several factors help explain San Bernardino’s crime profile:
- Violent crime is the main concern. The city has historically recorded high rates of aggravated assault, robbery and homicide compared with California overall.
- Homicide remains a significant issue. San Bernardino’s homicide rate has been substantially higher than the statewide rate in recent years, although the number of killings can fluctuate considerably from year to year.
- Gun violence contributes to serious offenses. Local and state law-enforcement reports have identified firearm-related assaults and other violent offenses as continuing public-safety concerns.
- Property and vehicle crime also contribute to the city’s overall crime rate. San Bernardino has experienced theft, burglary and motor-vehicle theft in addition to violent offenses.
- Crime is not evenly distributed across the city. A citywide crime rate is an average and does not mean every neighborhood has the same level of risk.
The distinction between crime rate and crime trend is important. California’s overall violent-crime rate fell 10.2% in 2025 to 431.1 per 100,000 residents, while San Bernardino continued to have a considerably higher violent-crime burden. The city has nevertheless recorded declines in some serious offenses, so describing it as dangerous should not imply that crime is increasing every year.
Q8. Is San Bernardino safe?
San Bernardino is generally considered a higher-crime city in California, particularly because of its elevated violent-crime rate. The city has historically reported higher rates of violent offenses such as aggravated assault, robbery, and homicide than California overall. However, recent data show declines in several major offenses, so its crime situation is better described as high but mixed rather than uniformly worsening.
In 2025, San Bernardino Police Department data through May recorded 834 violent crimes, including 191 robberies, 584 aggravated assaults, and eight homicides. Robbery declined 25% and firearm-related assaults fell 19% compared with the same period in 2024, although aggravated assault increased 8%.
Safety also varies across San Bernardino, so citywide crime statistics do not mean that every neighborhood has the same level of risk. Anyone considering living in or visiting the city should look at the specific neighborhood, current crime trends, and the type of crime being measured rather than relying only on the city’s overall ranking.